IUCN / SSC Cat Specialist Group - Digital Cat Library |
|
||||||||||
|
|
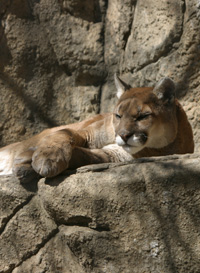
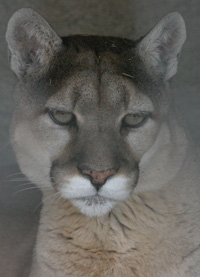
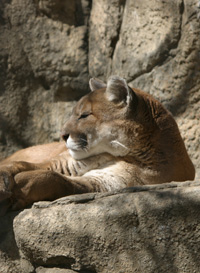
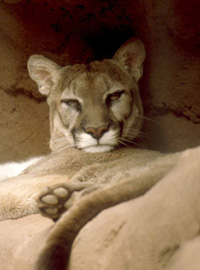
Puma - Puma concolor Maurice Hornocker and Sharon Negri have joined forces to produce "Cougar Ecology and Conservation", a seminal go-to resource for scientists, wildlife managers, biologists, conservationists, and anyone who has an interest in large carnivores. An anthology featuring twenty leading scientists from Canada to Patagonia, "Cougar Ecology and Conservation" is the first comprehensive book that spans the cougars entire range and includes a variety of topics surrounding this complex animal. Some articles about puma, covering different research topics and range countries, is also presented in this current Highlight. You can find more than 600 publications on puma in the Digital Cat Library. |
Articles
Latest updates to the Digital Cat Library |
|
Paviolo, A., Di Blanco, Y. E., De Angelo, C. D., and Di Bitetti, M. S. (2009). Protection affects the abundance and activity patterns of Pumas in the Atlantic forest. J. Mamm. 90(4): 926-934. |
|
Using camera traps, we conducted 4 surveys in 3 areas with different levels of protection against poaching and logging within the biggest continuous fragment of the Upper Parana Atlantic Forest. We used capture-mark-recapture population models to estimate the density of pumas for each area. The core area of Iguazu National Park, with low poaching pressure and no logging for 60 years, had the highest density of pumas (between 1.55 and 2.89 individuals/100 km2). Yaboty Biosphere Reserve, an area with the highest poaching and logging pressure, showed the lowest density (between 0.3 and 0.74 individuals/100 km2). Areas with intermediate levels of poaching and logging pressure had densities between 0.66 and 2.19 individuals/100 km2. |
||
|
Paviolo_et_al_2009_Abundance_and_activity_of_pumas_in_the_Atlantic_forest.pdf |
||
|
© A. Sliwa |
|
Durden, L. A., Cunningham, M. W., McBride, R., and Ferree, B. (2006). Ectoparasites of free-ranging pumas and jaguars in the Paraguayan Chaco. Veterinary Parasitology 137: 189-193. |
|
Ectoparasites were collected from puma and jaguar live-captures (each representing six different animals) in the Paraguayan Chaco from 2002 to 2004. The same five species of ectoparasites were recovered from both host species; the flea, Pulex simulans, and the ticks, Amblyomma cajennense, Amblyomma parvum, Amblyomma tigrinum and Amblyomma triste for any of these ectoparasite species between the two host species, and only P. simulans showed a significantly higher mean intensity (mean no. of each ectoparasite species per infested host) on one of the host species (jaguar). |
||
|
Durden_et_al_2006_Ectoparasites_of_pumas_and_jaguars_in_Paraguay.pdf |
||
© A. Sliwa |
|
Swanson, B. J. and Rusz, P. J. (2006). Detection and Classification of Cougars in Michigan Using Low Copy DNA Sources. Midl. Nat. 155: 363-372. |
|
We collected 297 scats from 12 areas in Michigan with heavy sighting reports of cougars. Ten scats produced DNA profiles consistent with cougars. One scat was identified as having a North American origin; the other nine scats produced no useable sequences. One pre-Columbian sample, from a Native American burial site; also matched the current North American genotype. Based on the distance between cougar scats, we conclude that there were at least eight cougars in Michigan during the 3 y of this study. The mtDNA sequences also suggest that at least some of the matrilines currently and historically found in Michigan are the same as those found in current and historical western populations. |
||
|
Swanson_&_Rusz_2006_Detection_and_classification_of_cougars_in_Michigan_by_DNA-analysis.pdf |
||
© A. Sliwa |
|
Kelly, M. J., Noss, A. J., Di Bitetti, M. S., Maffei, L., Arispe, R. L., Paviolo, A., De Angelo, C., and Di Blanco, Y. E. (2008). Estimating puma densities from camera trapping across three study sites: Bolivia, Argentina, and Belize. J. Mamm. 89(2): 408-418.. |
|
We estimated density of pumas using remote cameras across study sites in Bolivia, Argentina, and Belize. Average agreement on identification between pairs of investigators was nearly 80.0% and 3-way agreement was 72.9%. Identification of pumas as different individuals was uncommon with the remainder described as unidentifiable. Densities of pumas varied consistently from site to site regardless of investigator. Numbers of pumas in Argentina match those of low-density North American sites, and those for Belize are consistent with the Pantanal and high-density North American sites. |
||
|
Kelly_et_al_2008_Estimating_puma_densities_by_camera_trapping.pdf |
||
|
© M.J. Kelly et al. |
|
Rosas-Rosas, O. C., Bender, L. C., and Valdez, R. (2008). Jaguar and Puma Predation on Cattle Calves in Northeastern Sonora, Mexico. Rangeland Ecology and Management 61: 554-560. |
|
We documented the extent of predation by jaguars and pumas on cattle in 1999-2004 in northeastern Sonora. Jaguars and pumas killed only calves, and calves constituted 58% of prey biomass consumed by jaguars and 9% by pumas. Annual cause-specific mortality rates were low and cattle calf survival was high (0.89-0.98 annually). Collectively, confirmed jaguar and puma predation accounted for <14% (57/408) of total cattle losses, with jaguars responsible for 14% of all calf losses; this could increase to a maximum of 36% (146/408) if missing calves were included in the totals. 91% of all confirmed calf kills were associated with three individual jaguars in our study. Targeting problem cats rather than broad-scale predator control may therefore be a viable alternative to address chronic predation problems. |
||
|
Rosas-Rosas_2008_Jaguar_and_puma_predation_on_cattle_calves_in_Mexico.pdf |
||
© A. Sliwa |
|
Robinson, H. S., Wielgus, R. B., Cooley, H. S., and Cooley, S. W. (2008). Sink populations in carnivore management: cougar demography and immigration in a hunted population. Ecological Applications 18(4): 1028-1037 |
|
We monitored a heavily hunted population from 2001 to 2006 to test for the effects of hunting at a small scale (<1000 km2) and to gauge whether population control was achieved or if hunting losses were negated by increased immigration allowing the population to remain stable or increase. The observed growth rate of 1.00 was significantly higher than our predicted survival/fecundity growth rates of 0.89 (deterministic) and 0.84 (stochastic), with the difference representing an 11–16% annual immigration rate. We observed no decline in density of the total population or the adult population, but a significant decrease in the average age of independent males. We found that the male component of the population was increasing (observed male population growth rate, lambda = 1.09), masking a decrease in the female component (lambda OF = 0.91). |
||
© A. Sliwa |
|
Morrison, S. A. and Boyce, W. M. (2008). Conserving Connectivity: Some Lessons from Mountain Lions in Southern California. Conservation Biology 23(2): 275-285. |
|
We examined a case study from southern California that combines monitoring of radio-collared mountain lions with an assessment of land-protection efforts to illustrate lessons learned while attempting to maintain ecological connectivity in a rapidly urbanizing landscape. As in many places, conservation scientists have provided science-based maps of where conservation efforts should focus. But implementing corridors is a business decision based not solely on ecological information but also on cost, opportunity cost, investment risk, and other feasibility considerations. Here, the type and pattern of development is such that key connections will be lost unless they are explicitly protected. Keeping pace with conversion, however, has been difficult, especially because conservation efforts have been limited to traditional parcel-by-parcel land-protection techniques. |
||
|
Morrison_&_Boyce_2008_Conserving_connectivity_for_pumas_in_California.pdf |
||
© R. Staempfli |
|
Estrada Hernandez, C. G. (2006). Dieta, uso de habitat y patrones de actividad del Puma (Puma concolor) y el Jaguar (Panthera onca) en la Selva. Thesis: 1-54. Universidad de San Carlos de Guatemala. |
|
The Mayan Forest extends between Mexico, Guatemala and Belize. The jaguar and puma live sympatric in this zone. In this study three of the main components of the niche were analyzed and compared: diet, use of habitat and patterns of activity, evaluating if segregation between the jaguar and puma exists. The prey preferred by puma was three species of deer and agoutis. For the jaguar they were collared peccary, white-nosed coati and armadillos. Both species had a similar pattern of habitat use, where the "high forest" was used proportionally to its abundance, and both preferred the "low forest". As far as the activity pattern, both preferred nocturnal hours to move, although puma displayed more variability. |
||
|
Estrada_2006_Ecology_of_the_puma_and_jaguar_in_Guatemala.pdf |
||
|
© C.G. Estrada |
|
Kortello, D., Hurd, E., and Murray, L. (2007). Interactions between cougars (Puma concolor) and gray wolves (Canis lupus) in Banff National Park, Alberta. Ecoscience 14(2): 214-222. |
|
We studied diet and spatial overlap among cougars and gray wolves in Banff National Park, Alberta (1993-2004) to evaluate how wolf recovery in the park influenced diet choice and space use patterns of resident cougars. Cougars (n = 13) and wolves (n = 8 in 2 packs) were monitored intensively over 3 winters via radio telemetry and snowtracking. We documented a 65% decline in the local elk population following the arrival of wolves, with cougars concurrently switching from a winter diet primarily constituted of elk to one consisting mainly of deer and other alternative prey. Wolves were responsible for cougar mortality and usurping prey carcasses from cougars, but cougars failed to exhibit reciprocal behaviour. Cougar and wolf home ranges overlapped, but cougars showed temporal avoidance of areas recently occupied by wolves. |
||
|
Kortello_et_al_2007_Interactions_between_cougars_and_wolves_in_Banff_NP.pdf |
||
© A. Sliwa |
|
Ruth, T. K. (1998). Evaluating cougar translocation in New Mexico. J. Wildl. Manage. 1264-1275. |
|
Eight female and 5 male cougars 16-108 months old were translocated a mean distance of 477 km. Initial movement directions away from release sites were uniformly distributed about a 360° circle. Eight of 14 cougars had movement end points >80 km from their release sites, and end point directions were generally south, suggesting they homed toward the source population; 2 male cougars returned to their original home ranges. Dispersing cougars from a SAM reference population showed no southerly tendencies. Distances moved from release sites to end points ranged from 3 to 494 km; 4 cougars established home ranges =84 km from release sites. Mean pretranslocation home ranges were generally smaller than mean posttranslocation use areas. Nine of 14 translocated cougars died during the study. Translocation was most successful with cougars 12-27 months old. |
||
|
Ruth_et_al_1998_Evaluating_cougar_translocation_in_New_Mexico.pdf |
||
© A. Sliwa |
(c) IUCN/SSC Cat Specialist Group ( IUCN - The World Conservation Union) |